


3 scores max per player; No foul language, show respect for other players, etc.
Name | Score | Date | ||
|---|---|---|---|---|
| 1 | ||||
| 2 | ||||
| 3 | ||||
| 4 | ||||
| 5 | ||||
| 6 | ||||
| 7 | ||||
| 8 | ||||
| 9 | ||||
| 10 |
Game: CAT AND MOUSE
Aim: Catch the white mice
Method:
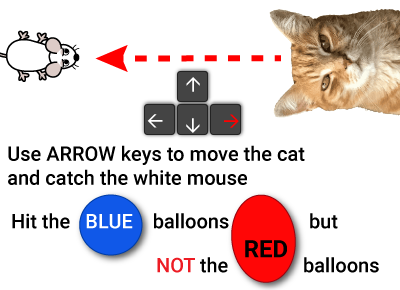
Move the cat with the arrow keys or by tapping in the game area to catch the white mouse. Avoid the red balloons but hit the blue balloons.
Your final score is based on all of that plus number of questions answered right, and the time taken.


HI
"Standard units: symbols to names"
The CAT AND MOUSE game to practice
'Stem & leaf: mode median range' for 8th grade
8th grade / Statistics / Discrete data / Stem and leaf / Stem & leaf: mode median range
Stem and leaf diagrams: mode, median, range
A stem and leaf diagram is a way of displaying a data set that shows the range of data in tabular form. Each data point is split into two parts, often splitting the first digit (the stem) from the remaining digit or digits (the leaf). This allows for a graphical division of the data into groups based on stems, with individual data points distinguished by their leaves. Stem and leaf diagrams can also be used for decimal numbers by splitting on the decimal point.
Stem and leaf diagrams make it relatively easy to find the mode, median and range for a data set. To find the mode from a stem and leaf diagram, look for the leaf value that appears most often in one row (do not count leaves from different rows as these are not the same value). The modal value is the most common leaf within one row combined with the stem according to the rule given by the diagram key.
To find the median value in a stem and leaf diagram, you should ensure that the diagram is ordered (stem values ascending from top to bottom, leaf values ascending from left to right). Then, count all the leaves in all the rows, and divide that number + 1 by 2. So if there are 15 leaves, the median value is at position (15 + 1) / 2 = 8. Count along all the leaves to the eighth leaf and read off the value as above by combining it with the stem value. If the median position falls between two leaves, calculate the median leaf value by adding the two values and dividing by two before combining it with the stem value.
To find the range of a stem and leaf diagram, take away the smallest value (stem and leaf) from the largest value (stem and leaf).
In this topic you are asked to calculate the mode, median or range of a series of stem and leaf diagrams. You will learn how useful these diagrams are for quickly deriving these values due to the way the data is laid out. There are 6 question/answer pairs in the lessons for this topic, and an additional 10 question/answer pairs in all the games and tests.
With our Cat and mouse math game you will be practicing the topic "Stem & leaf: mode median range" from 8th grade / Statistics / Discrete data / Discrete data. The math in this game consists of 16 questions that ask you to find the mode, median and range for each of these stem and leaf diagrams.

Cat versus mouse game with added balloons for math and fun. You are the ginger cat, and your life is being made a misery by some white mice which have come into the house and are proving hard to catch. Not to mention there is a mouse house party going on and lots of balloons getting in the way of your hunting.
So you have to catch the white mice, forget about the gray mice, hit the blue balloons but avoid the red balloons, and answer math questions (you are a CLEVER cat...). If it sounds complicated and a bit frantic, that's because it is. Do your best but don't worry if you can't catch all the mice - neither can we. It's a cat's life...
UXO * Duck shoot * The frog flies * Pong * Cat and mouse * The beetle and the bee
Rock fall * Four in a row * Sow grow * Choose or lose * Mix and match
Latest leaderboard entries: Cat and mouse


How to play CAT AND MOUSE to practice
'Stem & leaf: mode median range' for 8th grade

CAT AND MOUSE is a quirky take on the perennial enmity of ponderous predator and plucky prey. Here are the basics:
- Press "PLAY" on the CAT AND MOUSE settings page to open the game.
- You are a ginger cat overwhelmed by a serious mouse problem.
- Luckily your job is only to catch the white mice, not all the mice.
- Trouble is, they are not easy to catch and will try to avoid you.
- Use the arrow keys or tap the screen in the direction you want the cat to go.
- You will need fast reaction times to catch those white mice, and the balloons keep getting in the way.
- Mouse scores are 25 points for each white mouse caught, minus 5 points for each white mouse that escapes.
- When you do catch a white mouse, a math question will appear.
- Answer the math question correctly for those extra points...
- You get 50 points for each correct answer, but you lose 25 points for each wrong answer.
- Hitting blue balloons gives you extra points, but 3 hits on a balloon will burst it for that level.
- Hitting red balloons takes away points.
- Balloon scores are +5 or +10 points for blue balloons, -5 or -10 points for red balloons.
- This is a timed game and your final score is calculated by taking away your time in seconds from the points you have earned.
- If you get one of the 10 best scores you can add your name to the leaderboard for your chosen topic.


