
3 scores max per player; No foul language, show respect for other players, etc.
Name | Score | Date | ||
|---|---|---|---|---|
| 1 | ||||
| 2 | ||||
| 3 | ||||
| 4 | ||||
| 5 | ||||
| 6 | ||||
| 7 | ||||
| 8 | ||||
| 9 | ||||
| 10 |
Game: PONG
Aim: Break the bricks, score points
Method:
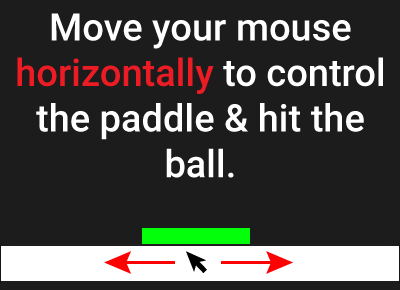
Use your mouse or tap in the white bar to move the paddle horizontally to bounce the ball up the screen. Answer questions when you break the white bricks, score big points with the yellow bricks.
Your final score is based on correct answers, bricks broken and time taken.


anonymous 🦊
"Two variables"
PONG game to practice
'Using lines of best fit' for 8th grade
8th grade / Statistics / Two variables / Scatter graphs / Using lines of best fit
Scatter graphs: use line of best fit to predict values
Scatter graphs use points to represent values that correlate the relationship between two variables. The scatter graph will indicate the degree to which the two variables are linked or related. If the variables are linked, you will be able to draw a line of best fit. The more strongly two variables are correlated, the more closely the points will follow the line of best fit.
One of the benefits of being able to draw a line of best fit is that it enables you to predict values for one of the variables that you don't have a data point for. To do so, you must first locate the independent variable on the x-axis. Draw an imaginary vertical line from that value up to the line of best fit. To get the y-axis value, draw an imaginary horizontal line from the line of best fit to the y-axis to read off the value.
It should be stressed that these predicted values will always be approximations, just as the line of best fit is usually an approximation relative to the actual data which tends to contain more variability in it than can be accommodated by a line of best fit.
In this topic you are asked to use the provided line of best fit to predict values for the dependent variable (on the y-axis) given a value for the independent variable (on the x-axis).
With our Pong math game you will be practicing the topic "Using lines of best fit" from 8th grade / Statistics / Two variables / Two variables. The math in this game consists of 16 questions that ask you to in each instance use the given line of best fit to predict approximate values.
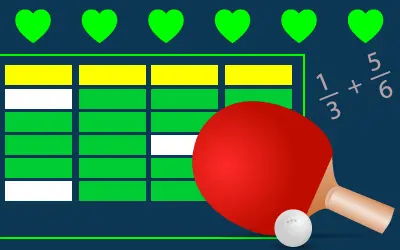
In our version of Pong/Breakout, there are 3 types of bricks for you to break: green bricks are worth just 2 points; yellow bricks are worth a whopping 50 points; breaking white bricks, which are worth 10 points, wins you a math question from the topic you have chosen.
You start with 5 lives. If the ball goes below the paddle, you lose a life and 200 points. The game ends when you answer all 10 questions or lose all your lives.
Notes
- This version of Pong is a one player game to learn or revise math
- Our PONG for math is a scoring game - play a few times and set a personal best score!
- Addictive! You may end up trying to avoid the white bricks so that you can play for longer...
UXO * Duck shoot * The frog flies * Pong * Cat and mouse * The beetle and the bee
Rock fall * Four in a row * Sow grow * Choose or lose * Mix and match
Latest leaderboard entries: Pong


How to play PONG to practice
'Using lines of best fit' for 8th grade

- Select the PONG game from the games selection page.
- On the settings page there are brief instructions on how to play.
- Click on PLAY to enter the game screen.
- The clock starts when the bell rings.
- Move your mouse (or finger tap or drag in the white bar for touch screens) to move your paddle left and right.
- Knock the ball back up the screen to break the bricks.
- You start with 1000 points and 5 lives.
- You lose 1 point every 2 seconds.
- 200 points are deducted from your score for each life lost
- Green bricks score 2 point, yellow bricks score 50 points, white bricks score 10 points and open the question screen.
- For each question click/tap on the correct answer or enter it using the keyboard.
- Wrong answers lose you 25 points but correct answers win you 50 points.
- Continue breaking bricks and answering questions until you have cleared all the question bricks.
- The game also ends if you lose all 5 of your lives.


