

8th grade Statistics topics for Secondary math learners
| Topic icon key | ||
eq | Equation | Each item in the topic is in the form of an equation |
id | Identify | Each item in the topic is a thing |
mi | Missing item | Each item in the topic is a statement with a missing term |
10 | Number of items | There are 10 items in this topic |
8 | Extended items | Additional questions for games and tests in this topic |
Our math topics for 8th grade learners are designed to follow closely the Common Core standards for math for 8th grade pupils.
Statistics syllabus for 8th grade
The math curriculum for statistics for students aged 13 to 14 introduces key concepts and skills related to data analysis, representation, and interpretation. Here are some key aspects of the math curriculum for Statistics for students aged 13 to 14:
Data Collection and Sampling Methods: Students learn about different methods of data collection, including surveys, experiments, and observational studies. They explore the concepts of population and sample and understand the importance of random sampling. They learn to design surveys and experiments to collect data.
Data Representation: Students learn to represent and organize data using various formats, including tables, charts, and graphs. They explore different types of graphs, such as bar graphs, line graphs, pie charts, and histograms. They learn to choose appropriate representations based on the type of data and the purpose of analysis.
Measures of Central Tendency: Students learn about measures of central tendency, including mean, median, and mode. They calculate these measures and understand their interpretation in different contexts. They learn to recognize situations where each measure is appropriate and analyze their strengths and limitations.
Measures of Variability: Students explore measures of variability, such as range, interquartile range, and standard deviation. They calculate these measures to understand the spread or dispersion of data. They compare and contrast measures of variability and use them to interpret data sets.
Data Interpretation and Analysis: Students learn to interpret and analyze data sets. They identify patterns, trends, and outliers in data and draw conclusions based on their observations. They analyze data to make predictions, draw inferences, and communicate their findings using appropriate mathematical language.
Probability and Statistics: Students make connections between probability and statistics. They explore concepts such as likelihood, random variables, and probability distributions. They use probability concepts to interpret and analyze data, calculate probabilities, and draw conclusions based on statistical inference.
Statistical Graphs and Diagrams: Students further explore statistical graphs and diagrams. They learn about box plots, stem-and-leaf plots, and scatter plots. They interpret these graphs and use them to analyze and compare data sets. They explore the relationships between variables in scatter plots.
Sampling Distributions: Students learn about sampling distributions and their role in statistical inference. They understand the concept of a sampling distribution of a statistic and how it relates to the population parameter. They explore the concept of sampling variability and its impact on statistical analysis.
Statistical Inference: Students are introduced to basic concepts of statistical inference. They learn about hypothesis testing, confidence intervals, and significance levels. They use statistical inference to make decisions, draw conclusions, and communicate their findings based on data.
Real-World Applications: Students apply statistical concepts and skills to real-world applications. They analyze and interpret data in various contexts such as social sciences, sports, economics, and science. They engage in critical thinking, problem-solving, and decision-making using statistical reasoning.
Throughout the curriculum, students engage in hands-on data analysis activities, exploratory data investigations, and real-world applications to reinforce their understanding of statistics. They develop their skills in data collection, analysis, interpretation, critical thinking, and mathematical communication.
Two variables topics for 8th grade
8th grade → Statistics → Two variables → Scatter graphs
Polarity, strength of correlation
Identify the polarity and strength of any linear correlation for each of the given scatter graphs
Line of best fit
Identify which of the lines is closest to being a line of best fit for the data
Using lines of best fit
In each instance use the given line of best fit to predict approximate values
Construct scatter graphs
Identify the correct steps for constructing a scatter graph from the options offered
A topic is selected at the beginning of a session at Free Math Games and will be remembered when you move between games or activities. The math for the topic is carefully constructed to match the level of difficulty taught in US schools. This means that you as a secondary pupil should see similar math problems to those you are seeing at school (if you are at school) for any particular subject. Please let us know if that is not the case.
See the help box below for instructions on choosing a topic here at Free Math Games.
UXO * Duck shoot * The frog flies * Pong * Cat and mouse * The beetle and the bee
Rock fall * Four in a row * Sow grow * Choose or lose * Mix and match


How to choose a 8th grade Statistics topic for Secondary math

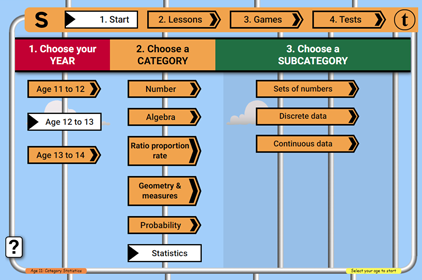
Click on the "1. Start" button in the top navigation bar - that brings you to this Secondary level topic selection page. On the topic selection page you will see that the topics are divided up:
- By level (Preschool, Elementary and Secondary)
- By grade (6th to 8th for this level)
- Into broad categories
Since you are currently within the Secondary section of Free Math Games you will see the Secondary topics. The Secondary grades will have loaded. Choose your grade. The broad categories available will load. Click on a category to see the available sub-categories and topics.

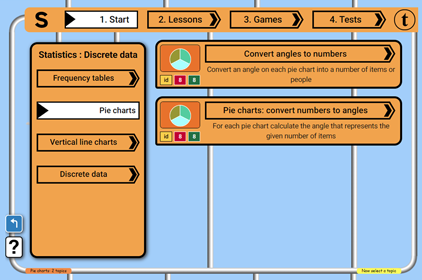
For example, if you choose 7th grade, then the category: "Algebra" and the sub-category "Sequences" you will be offered a choice of sub-sub-categories and topics suitable for your school grade - in the case of this example, "Generating terms" and "nth term expressions". Click on each sub-sub-category to view the available topics.
When you click on the name of a topic, the topic will load into the lesson page (once a topic has loaded it will be available for all activities and will not have to be downloaded again) and the lesson start page will be displayed. You can choose to do the lesson or jump immediately to the games using that topic.


