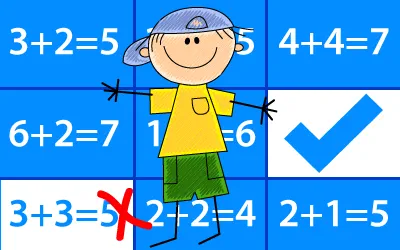
Game: FOUR IN A ROW
Aim: To get four symbols in a row
Method:
Choose a square and click on it. Click on the correct answer to the question in the box that appears. If you are right the square is replaced by a tick. Continue until you have won 4 in a row...


anonymous 🚫💏🚫
"Number bonding to 10,000"
4 IN A ROW game to practice
'Polarity, strength of correlation' for 8th grade
8th grade / Statistics / Two variables / Scatter graphs / Polarity, strength of correlation
Polarity and strength of correlation for scatter graphs
Scatter graphs use dots or diagonal crosses to represent values that correlate the relationship between two variables. The scatter graph will indicate the degree to which the two variables are correlated (linked or related).
For instance, a scatter graph plotting altitude (x-axis) against Oxygen concentration (y-axis) will indicate a strong correlation between these two variables because Oxygen concentration reduces with altitude (the reason climbers can suffer from altitude sickness). On the other hand, a scatter graph plotting eye colour against exam results will show no correlation because these two variables have no causal relationship.
The polarity of a correlation can be characterised as "positive" or "negative". This indicates whether an imaginary straight line drawn through the points (a line of best fit) rises to the right (positive - as the x-axis variable increases, so does the variable on the y-axis) or falls to the right (negative - as the x-axis value increases, the y-axis variable decreases). So, thinking about our example of altitude plotted against Oxygen concentration, we will see a negative correlation because the concentration decreases as the altitude increases. A positive correlation would be seen if we plotted a child's age against shoe size: as their age increases, so does their shoe size.
The strength of a correlation can be characterised as "strong" or "weak". A strong correlation will be indicated on a scatter graph by points that closely follow a line of best fit. A weak correlation will show points that are more loosely concentrated around a line of best fit.
In this topic you are asked to decide which of the descriptions provided best describe the correlation between the variables plotted on the x and y axes. The possible options are:
- Strong positive correlation
- Strong negative correlation
- Weak positive correlation
- Weak negative correlation
- No correlation
With our Four in a row math game you will be practicing the topic "Polarity, strength of correlation" from 8th grade / Statistics / Two variables / Two variables. The math in this game consists of 16 questions that ask you to identify the polarity and strength of any linear correlation for each of the given scatter graphs.
The game will reinforce the math you have chosen to learn by getting you to match the question to the correct answer.
Notes
- Do the Math lessons for your topic before playing this game
- Wrong answers are ok, you just have to try again until you get them right
- There is help available for all games by clicking the question mark button
UXO * Duck shoot * The frog flies * Pong * Cat and mouse * The beetle and the bee
Rock fall * Four in a row * Sow grow * Choose or lose * Mix and match


How to play 4 in a row to practice
'Polarity, strength of correlation' for 8th grade

- Select "4 in a row" on the math games selection page.
- Take a quick look at the method text for 4 in a row.
- Click on PLAY to proceed, or change your topic with the CHANGE TOPIC button.
- On the play page you have a grid of 16 pictures (some topic picture are shown multiple times for shorter topics).
- Click on a picture cell.
- The topic question will appear along with a series of possible answers.
- Click the speaker icon to hear any particular answer (Speech enabled browsers only).
- Click the answer that corresponds to the picture question.
- If you are correct, the picture will be replaced by a tick - otherwise, a wrong sound will play.
- Continue matching picture questions to their correct answers until you have completed a line of 4 cells.
- The line can be diagonal as well as horizontal or vertical.
- 4 ticks in a row wins the game.
- Choose an option from the green sign, or click on games to choose a different game.